hotspots-of-change
Hotspots of change - Neotropical carnivores
![]()
A continental-wide decline of occupancy and diversity in five Neotropical carnivores
Florencia Grattarola ![]() , Kateřina Tschernosterová, Petr Keil
, Kateřina Tschernosterová, Petr Keil ![]()
This repository (https://github.com/bienflorencia/hotspots-of-change) includes the data, code, model and outputs for our work on mapping the temporal change, the areas where gains and losses accumulated for all species (hotspots of change), and calculating the temporal species turnover and change in spatial turnover.
Species
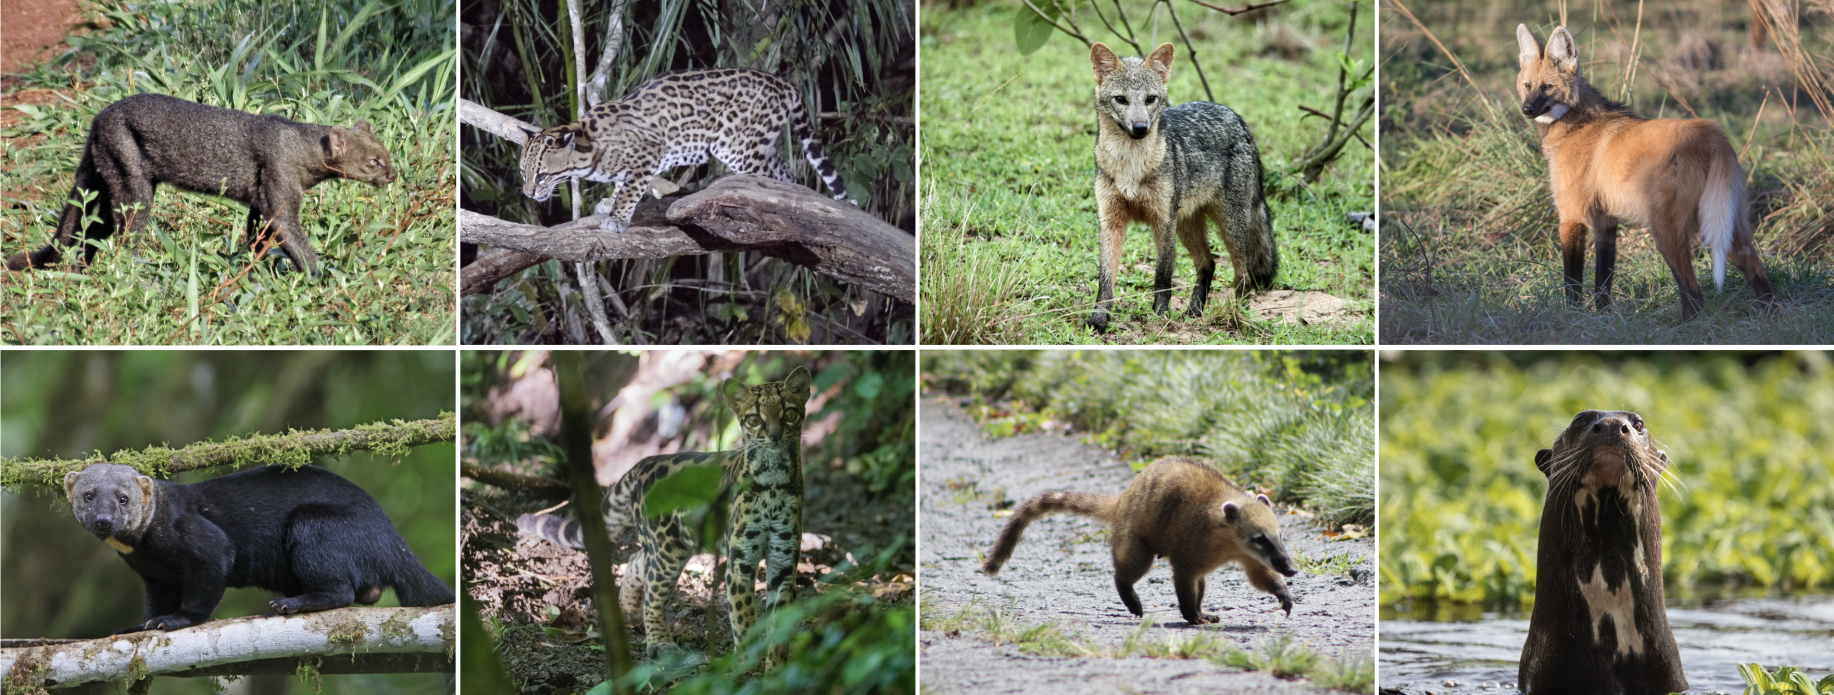
Photo credits iNaturalist.org: jaguarundi (Herpailurus yagouaroundi) by @hhulsberg, ocelot (Leopardus pardalis) by @cotingidae, crab-eating fox (Cerdocyon thous) by @farpost, maned wolf (Chrysocyon brachyurus) by @constanzamcl, tayra (Eira barbara) by @christoph_moning, margay (Leopardus wiedii) by @bigsam, coati (Nasua nasua) by @douglasmeyer, and giant river otter (Pteronura brasiliensis) by @npdowling.
1) Source data: the raw data sources
- 32 literature sources digitised for this study:
data/raw/OWN_literature_extraction.csv. - GBIF.org. (2024). ‘Occurrence Download Neotropical Carnivores’. https://doi.org/10.15468/dl.67zvau
- Nagy-Reis et al. (2020). ‘NEOTROPICAL CARNIVORES: A Data Set on Carnivore Distribution in the Neotropics’. Ecology 101(11): e03128. https://doi.org/10.1002/ecy.3128
2) Underlying data: the data we generated
Tables
data/data_PO.csv: a csv file with the cleaned, standardised and harmonised presence-only data.data/data_PA.csv: a csv file with the cleaned, standardised and harmonised presence-absence data.data/carnivores.csv: a csv file with the carnivore species list extracted from the Mammal Diversity Database, including the family, taxon key from GBIF and IUCN conservation status.
Spatial files
data/latam_raster.tif: a raster file with 2 layers;latama raster of 100x100 km cell resolution of Latin America, andcountries: a raster of 100x100 km cell resolution of the countries of Latin America.data/latam.gpkg: a geopackage with 3 layers;countries: a multi polygon sf file for the 56 countries of Latin America,latama single polygon that combines all countries of Latin America, andlatam_landa single polygon that combines all the landmass countries of Latin America (excluding islands).
Other files
docs/digitised_references.bib: BibTeX bibliographical database file with the 32 literature references digitised and included in our database.docs/*species*_model_diagnostics.pdf: PDF files with the JAGS model diagnostics output (one per species).models/*species*_model.txt: text files with the JAGS models used for each species.
3) Extended Data: the code we used to process the data
For each species: Cerdocyon thous, Chrysocyon brachyurus, Eira barbara, Herpailurus yagouaroundi, Leopardus pardalis, Leopardus wiedii, Nasua nasua, and Pteronura brasiliensis, these are the steps in the workflow:
- Prepare data
- Clean PO and PA data for all species:
code/1_1_clean_PO_PA_data.qmd/ html - Create range maps distance to the edge as a covariate:
code/1_2_create_range_map_covariate.qmd/ html - Visualise PO grid-cells and PA blobs:
code/1_3_visualise_grids_and_blobs.qmd/ html
- Clean PO and PA data for all species:
- Analyse species by species (see species folders: Cerdocyon thous, Chrysocyon brachyurus, Eira barbara, Herpailurus yagouaroundi, Leopardus pardalis, Leopardus wiedii, Nasua nasua, and Pteronura brasiliensis
- Data Generation:
*species*_1_dataGeneration.qmd - Variable Selection:
*species*_2_variableSelection.qmd - Data preparation for modelling:
*species*_3_dataPreparation.qmd - Model run:
*species*_4_modelRun.qmd - Model outputs:
*species*_5_modelOutputs.qmd
- Data Generation:
- Calculate hotspots of change
- Sample from the posterior:
3_1_sampling_from_posterior.R - Species richness, change and beta diversity:
3_2_species_richness_change_and_beta_diversity.qmd/ html
- Sample from the posterior:
Also, finde here the JAGS models used for each species: models.
LICENCE
Data are available under the terms of the Creative Commons Attribution 4.0 International licence CC-BY 4.0 (https://creativecommons.org/licenses/by/4.0/legalcode.en).
Code is available under the terms of the GPL-3.0 licence (https://www.gnu.org/licenses/gpl-3.0.html).
CITATION
Grattarola F. (2024) A continental-wide decline of occupancy and diversity in five Neotropical carnivores. Zenodo. 10.5281/zenodo.13866885 . [Data/Code]
Grattarola F., Tschernosterová K., & Keil P. (2024) A continental-wide decline of occupancy and diversity in five Neotropical carnivores. Global Ecology and Conservation. https://doi.org/10.1016/j.gecco.2024.e03226